Gerardo Furtado
|
d3.js
Home
|
Portfolio of Works
|
Demos
|
About me
This is a collection of demos and examples I've made using D3.js, just for fun, to show the D3 capabilities. Most of the data in the visualizations here are real, see more details in each datavis.
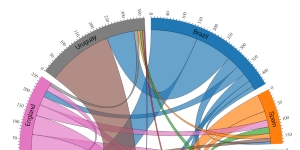
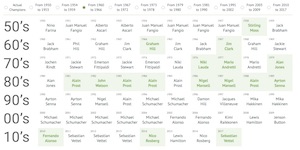
All the Champions, All the Goals
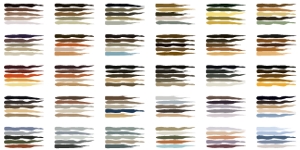
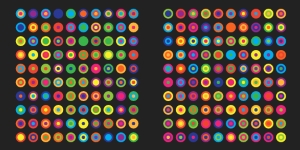
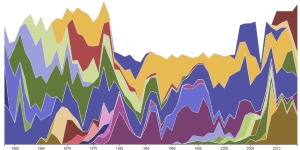
Painters' Palettes
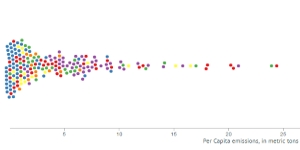
CO
2
Emissions, a beeswarm plot
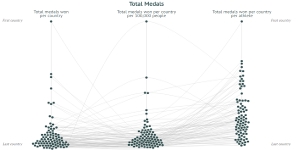
Summer Olympics: Medal Tally
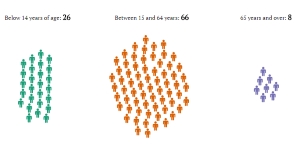
One hundred people
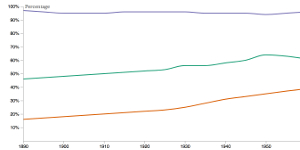
Scrubbable Line Charts
From Bars to Scatter
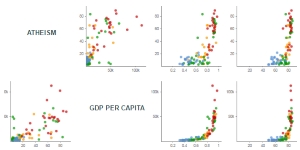
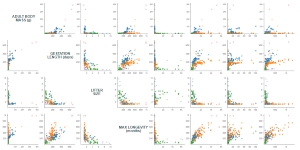
Small Multiples of Scatter Plots
Small Multiples Scatter Plots, part II
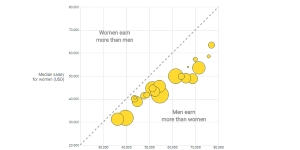
Gender Pay Gap: a Scrollytelling
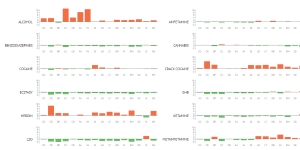
Drug Harms
Drug Harms, part II
Visualizing Remoteness
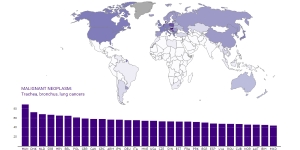
Cancers: choropleth + bar chart
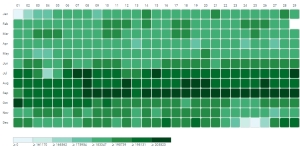
Births: a heat map
How Many Meters?
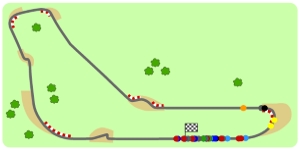
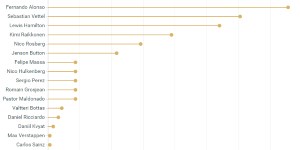
Formula 1: Alternative Champions
Dollars per Point: Lollipop Chart
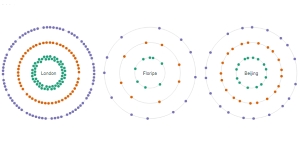
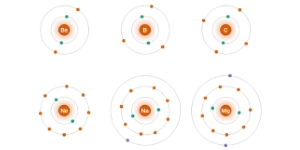
Atoms and Their Electrons
Obesity and Education
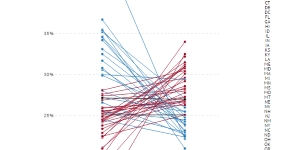
Formula 1: Teammates Battle
The Walk of Genes
CO
2
Emissions
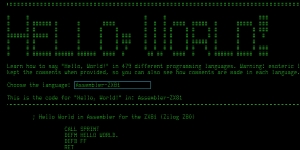
Hello, World!
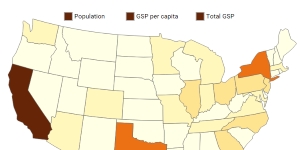
Normalize Your Choropleths!
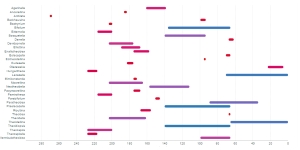
Stratigraphic Range
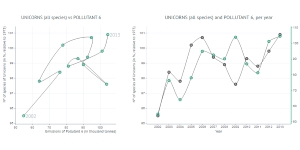
Organisms and Pollutants
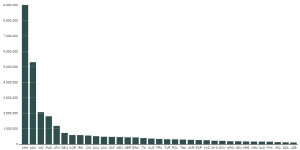
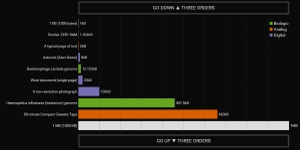
Orders of Magnitude
Visualizing Digits
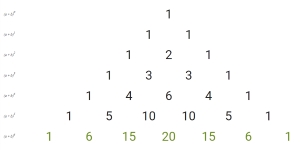
Pascal's Triangle
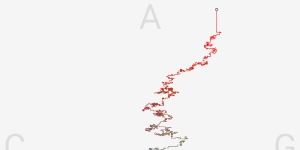
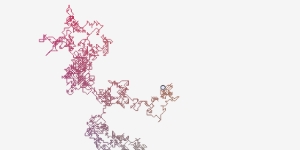
The Walk of Pi
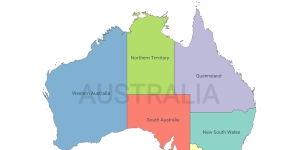
Australia Map
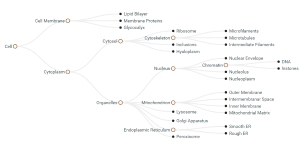
Eukaryotic Cell Structure
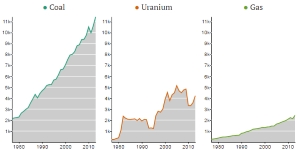
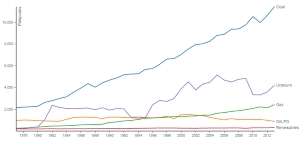
Australian Energy: Line Chart
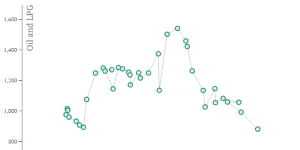
Australian Energy: Scatter Plot
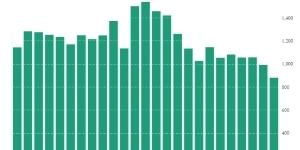
Australian Energy: Bar Chart
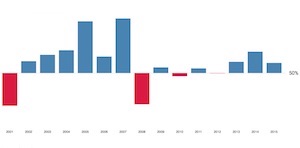
Performance of Formula 1 Teams
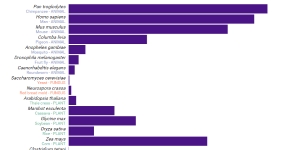
Genome Size and Number of Genes
All charts and data visualizations made with
d3.js
, a JavaScript library for manipulating documents based on data.